
More than just Amazon - Immigration in Seattle, 2010-2017

Researchers: Dr. Richard W. Sharp & Dr. Patrick W. Zimmerman
Project Summary
Over the last decade, Seattle has become one of the fastest growing areas in the country. EPCW is mapping immigration patterns over this time in the Seattle Metropolitan Statistical Area to help people understand the ways that in-migration has contributed to the growth and richness of the region.
Key questions:
- What populations will be most impacted by current resources and policies, and how do these populations changed when allocations and policy were decided?
- How much does the Puget Sound region’s economic, social, and cultural map depend on arrivals from elsewhere?
- How much would economic output change if, for instance, a wall was constructed to keep out everyone not born in the USA?
Preliminary findings
It’s not just the techies.
Growth in Seattle cannot be simply reduced and equated to “gentrification.” Yes, the tech boom centered around Amazon’s evolution from an online bookstore to one of the largest companies in the world has created an influx of high-earning immigrants, both foreign and domestic, to some areas of Seattle. But there’s more to this story.
While the headlines have told us that over 100,000 people have moved into the city, the other states and countries from which people have moved, and the growth, outflux, and movement among long-term residents are less understood. Important parts of the population boom, particularly growth in its minoritized populations, are happening in regions far from the tech core.
The causes and location of Seattle’s growth will have consequences in the new decade. In addition to growth’s immediate impact, the city will soon redraw its 7 city council districts in 2022. Given the local political influence that the industry wields (e.g., Amazon’s political spending on the 2019 city council election and its role in the repeal of the head tax), it is not clear how well the redistricting process will serve the residents as compared to other interests.
Population growth in the City of Seattle by Census Tract
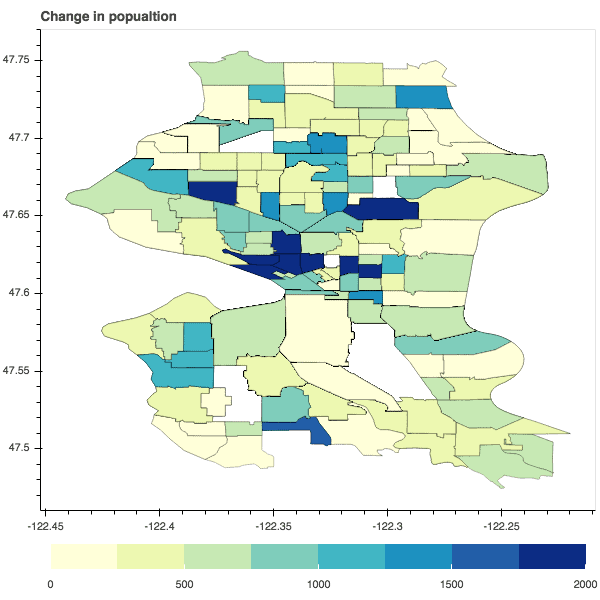
Total population growth, 2010-17
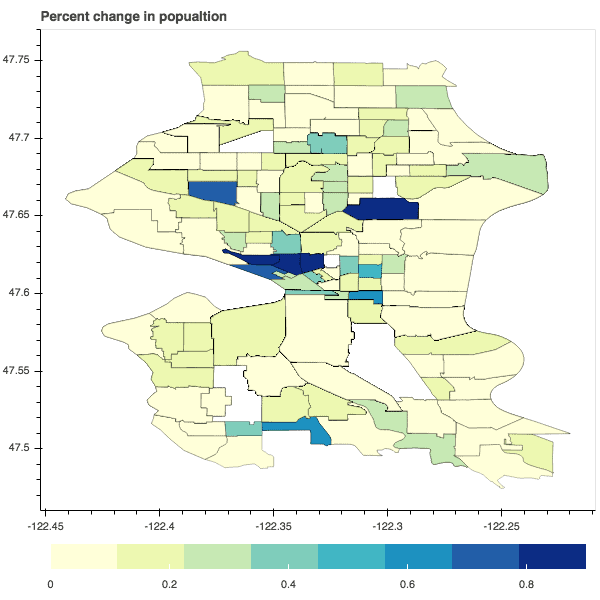
Total population % change, 2010-17
Minoritized population growth in the City of Seattle by Census Tract
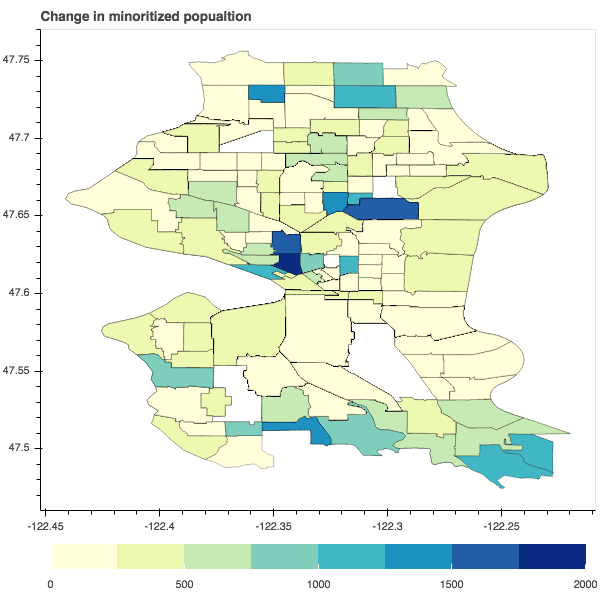
Minoritized population growth, 2010-17
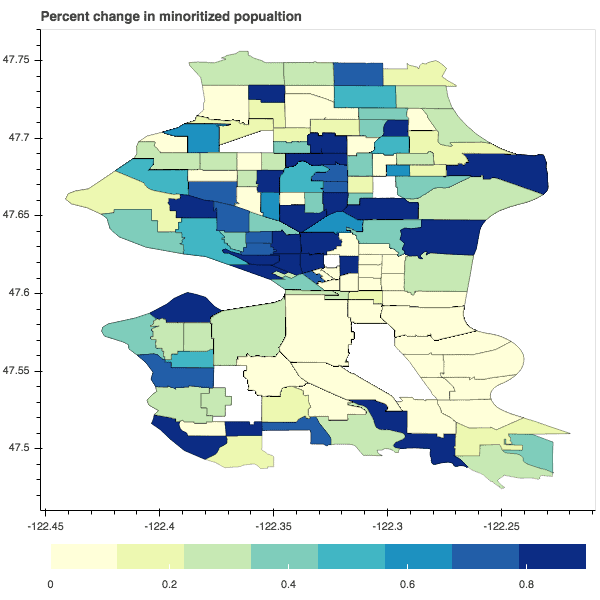
Total population % change, 2010-17
Data Sources & Methodologies
Population data from the US Census’ American Community Survey 5-year data. Economic data pulled from Federal Financial Institutions Examination Council.
Maps created with python, using Geopandas.
Raw data and ACS data pull scripts posted on github.